

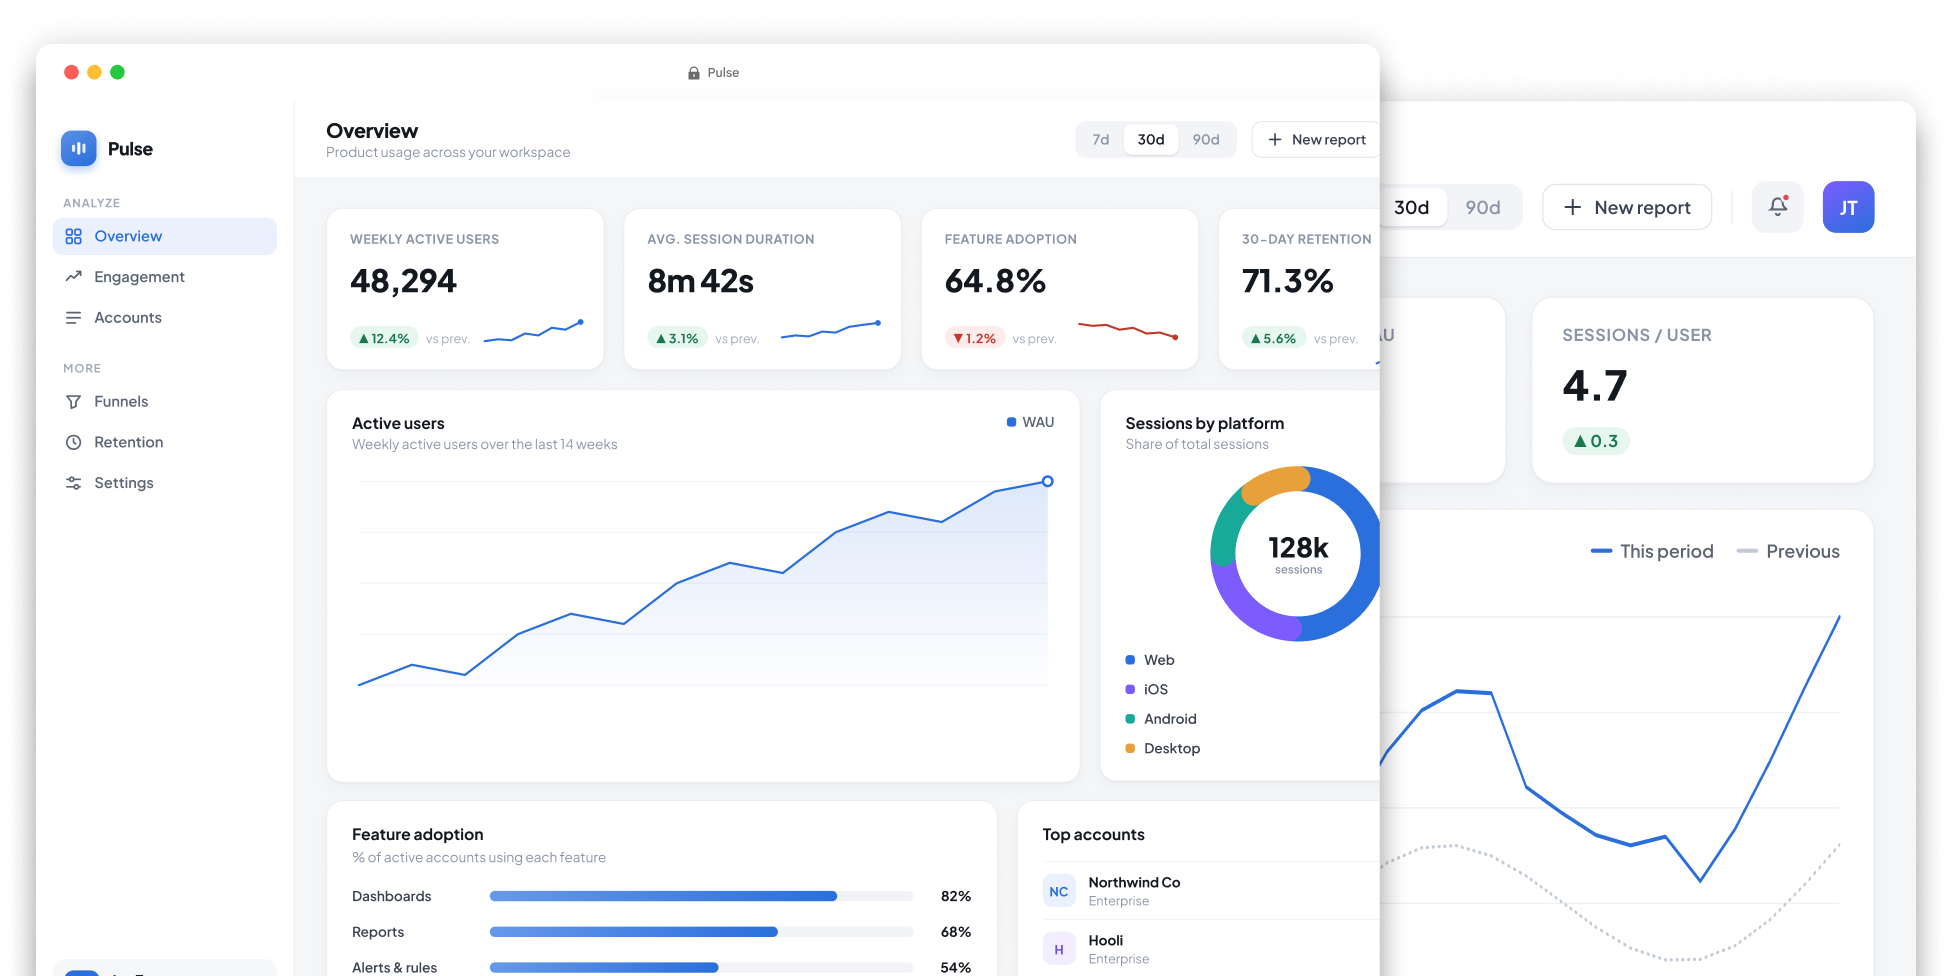
SaaS Analytics Dashboard
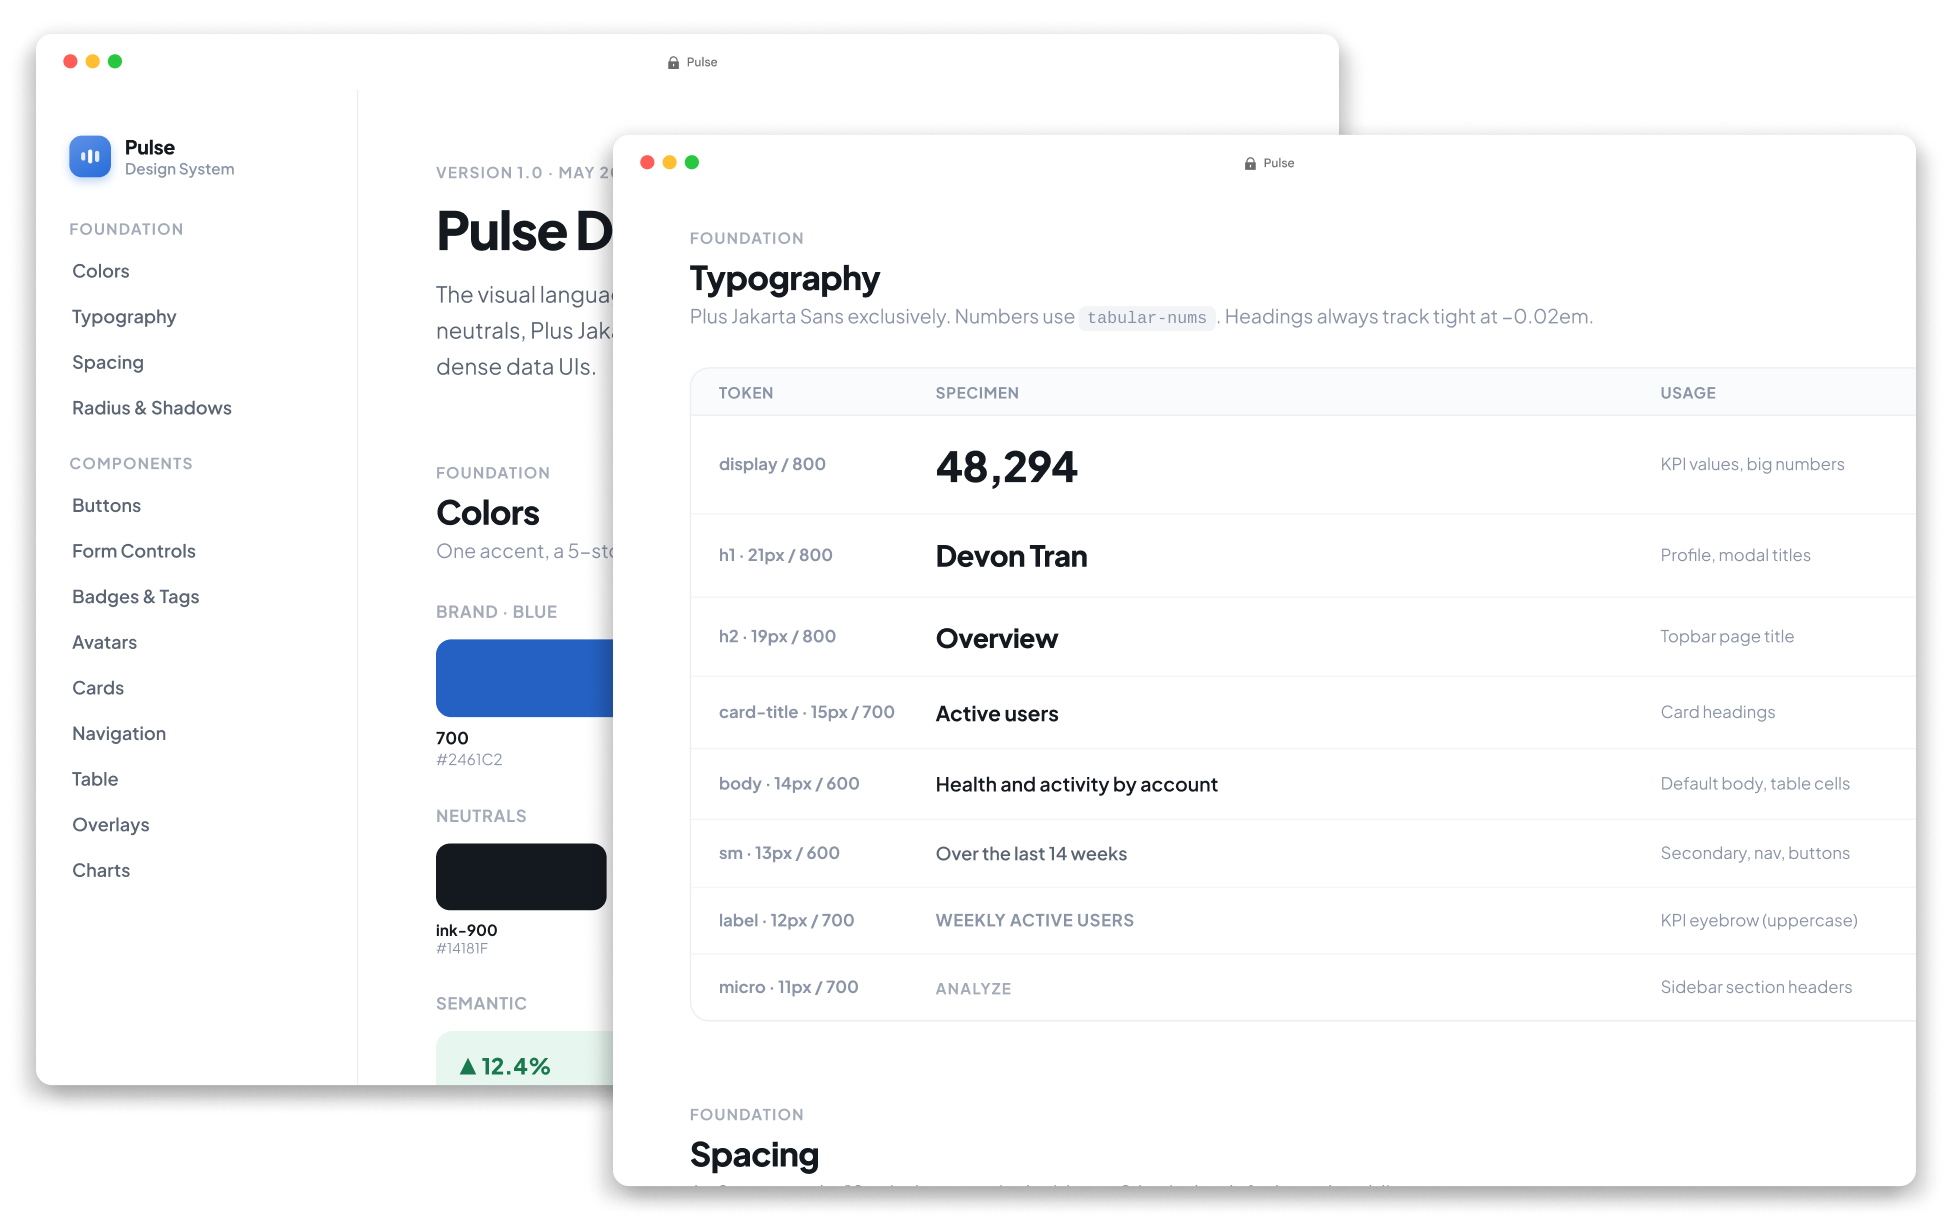
Internal teams were building their own versions of the same dashboards because there was no shared language for visualizing product metrics. This project replaced that fragmented approach with a configurable dashboard system that product teams could assemble quickly using standardized, validated components.
Role
Senior UX/UI Designer
Year
2020
Platform
Web — app
Team
1 designer · 4 engineers
The challenge
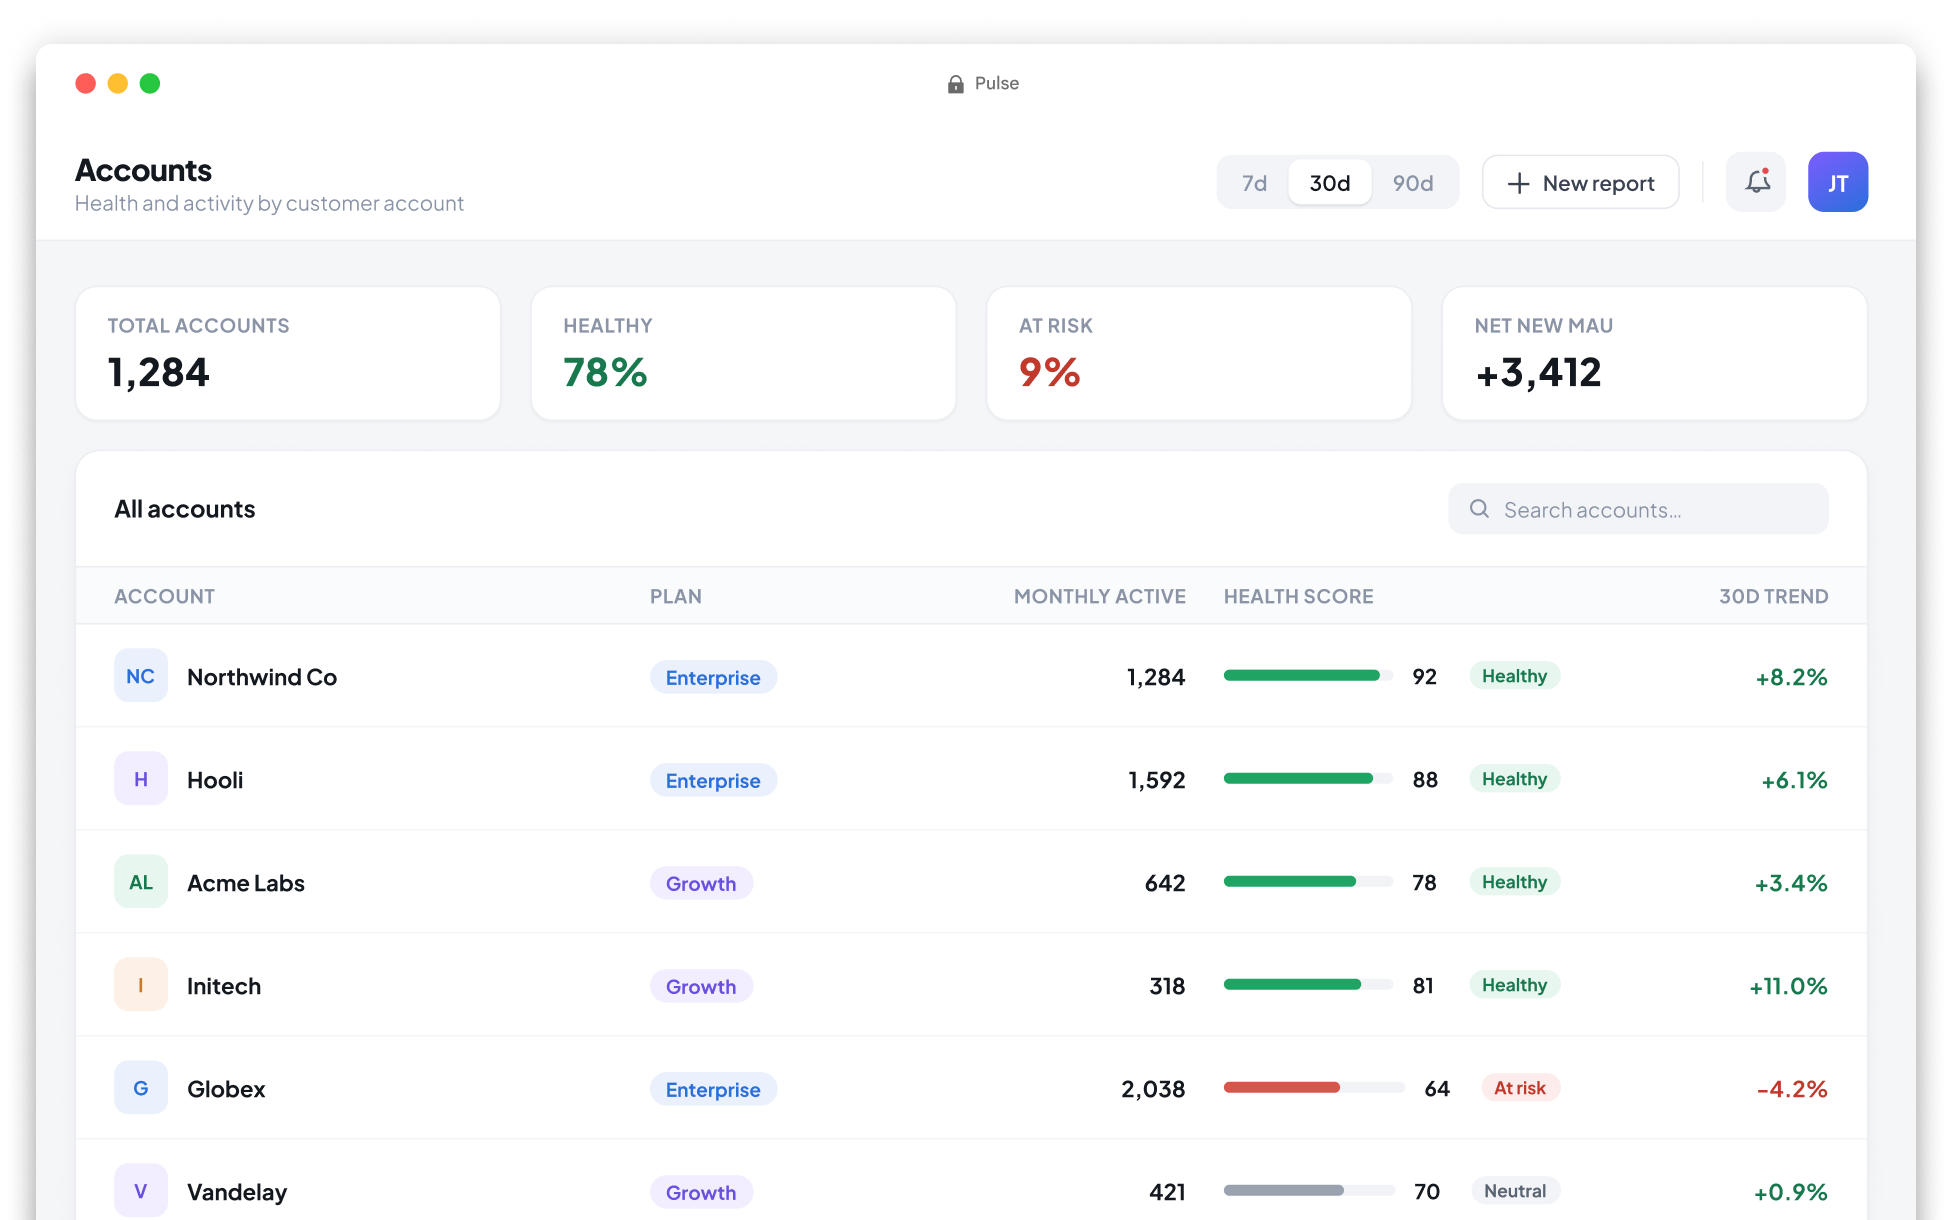
Each team maintained its own ad hoc dashboard, implemented slightly differently from one product to another. As a result, comparing metrics across teams was difficult, and there was little confidence that the same metric represented the same thing in every context.
The approach
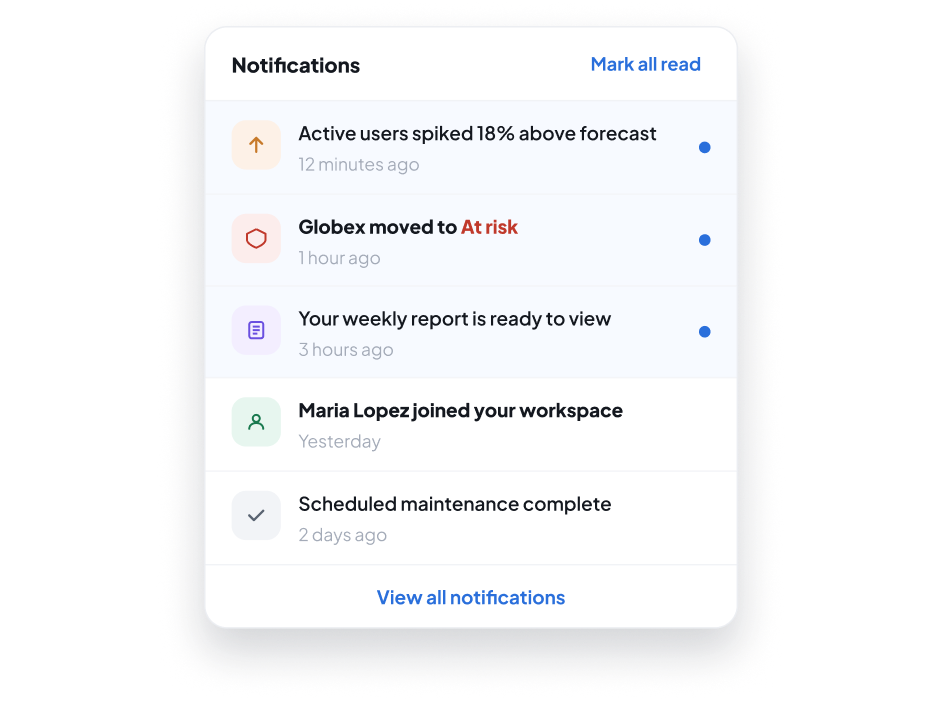
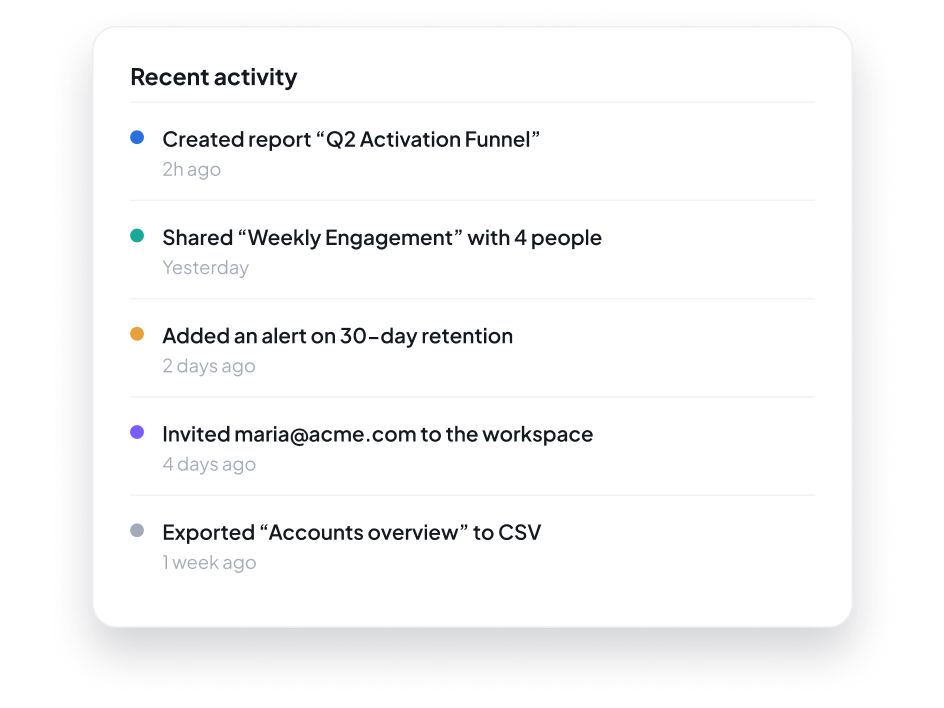
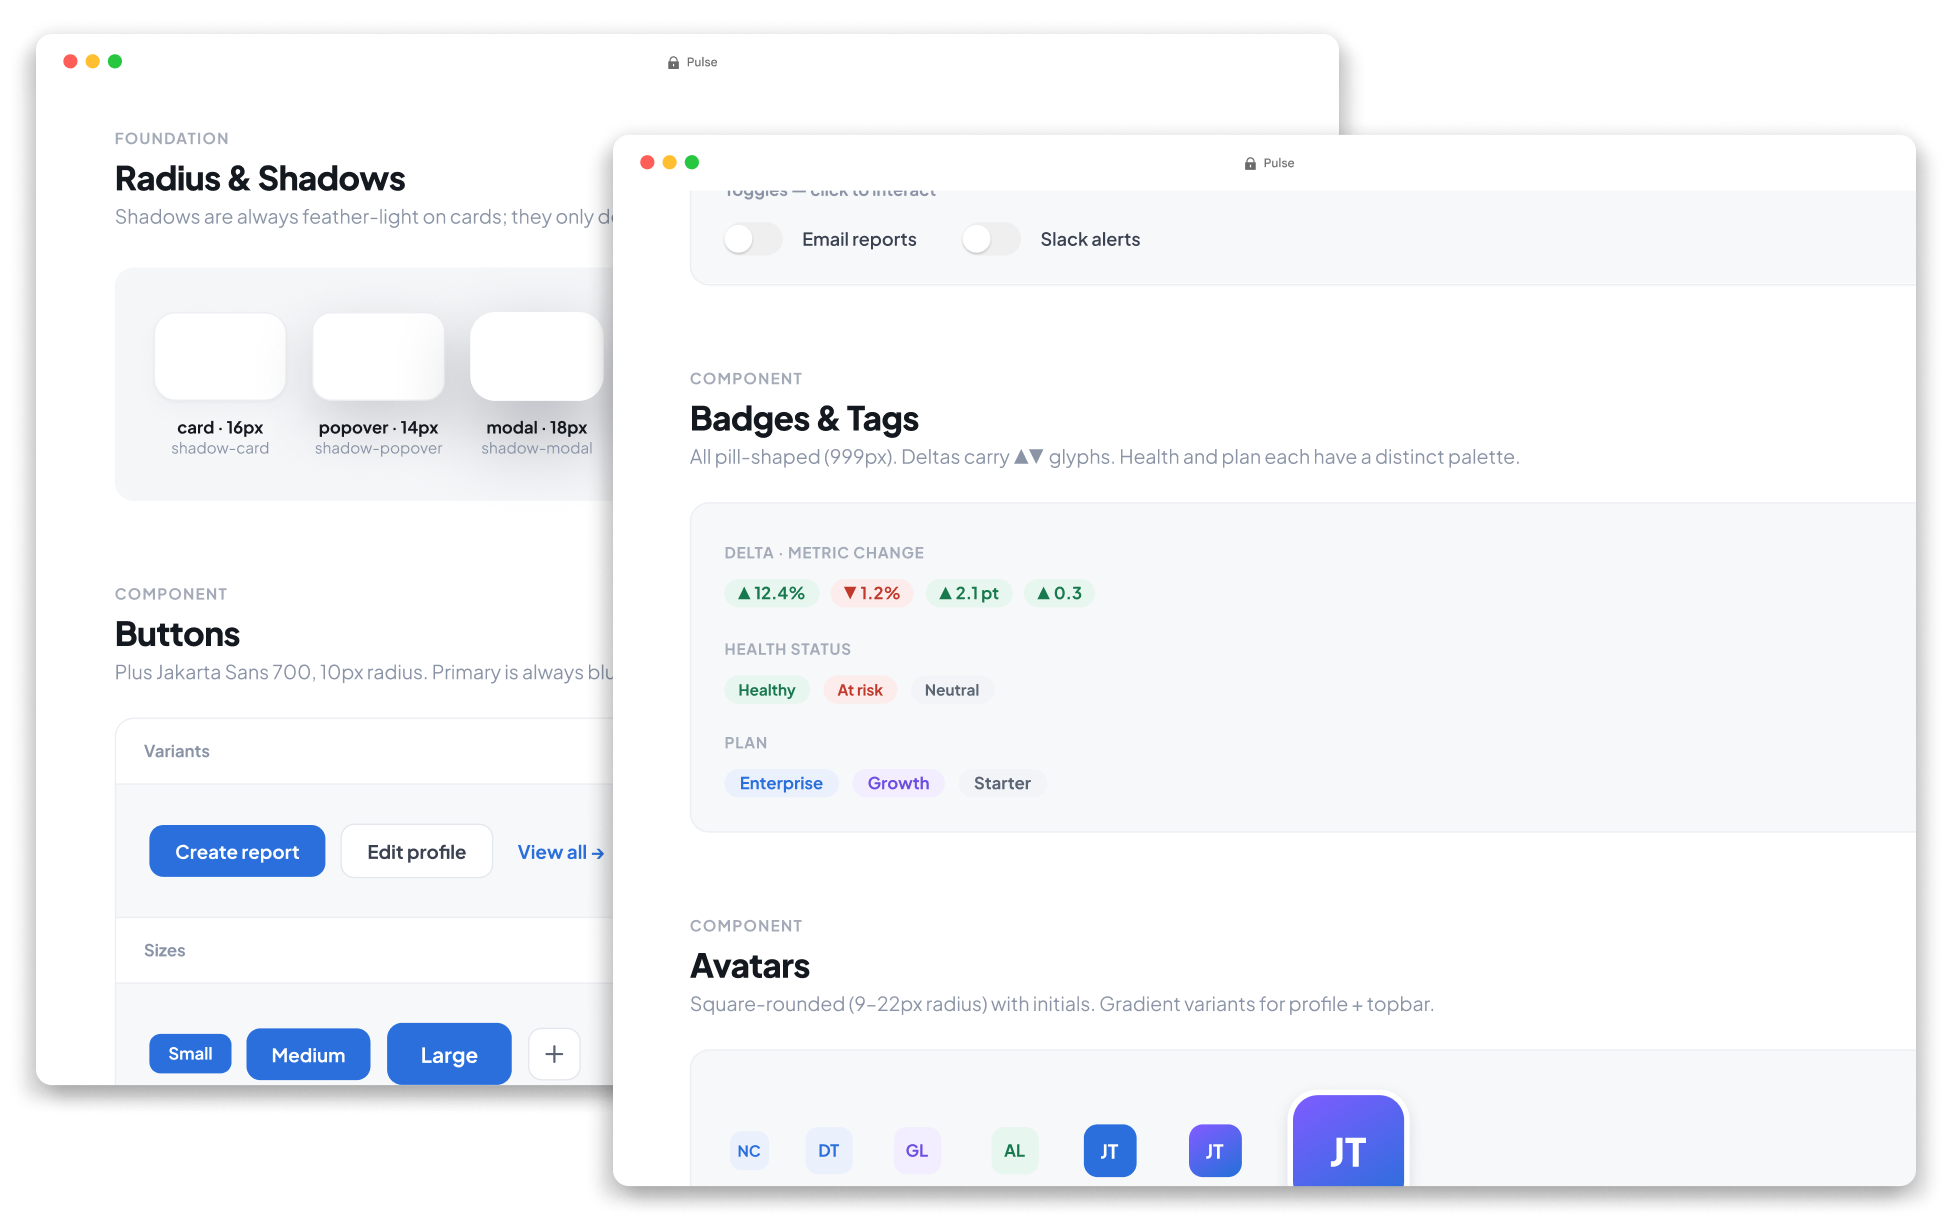
I designed a system of configurable widgets built on top of a shared component library, enabling any team to compose dashboards using the same validated building blocks instead of creating new, inconsistent implementations for each dashboard.
The outcome
Standardizing the component library significantly reduced the effort required to build dashboards while ensuring a consistent user experience. Teams were able to deliver new dashboards using the same library of validated components, reducing implementation time, improving interface consistency, and making metrics directly comparable across products.
Full case-study detail is shared directly with employers, hiring managers, and potential clients — I approve most requests within a few hours.
Request access